


(C) 2011 Stephanie F. Loria. This is an open access article distributed under the terms of the Creative Commons Attribution License, which permits unrestricted use, distribution, and reproduction in any medium, provided the original author and source are credited.
For reference, use of the paginated PDF or printed version of this article is recommended.
More than 85 species of cave-obligate (troglobiotic) millipede have been described from North America. Understanding the patterns and processes that determine their distribution in this region is an area of recent research. Here, we present the first molecular phylogeographic study of troglobiotic millipedes. Millipedes of the genus Tetracion Hoffman, 1956 (Callipodida: Abacionidae) inhabit caves on the Cumberland Plateau in Tennessee and Alabama, a global hotspot for cave biodiversity. Three species have been described: Tetracion jonesi Hoffman, 1956, Tetracion antraeum Hoffman, 1956, and Tetracion tennesseensis Causey, 1959. To examine genetic divergence within and between species of Tetracion we sequenced part of the mitochondrial cytochrome oxidase 1 gene from 53 individuals from eleven caves across the range of Tetracion tennesseensis and in the northern part of the range of Tetracion jonesi. We found: (1) little variation within species (six haplotypes in Tetracion tennesseensis and four haplotypes in Tetracion jonesi, with a maximum of 1.4% intraspecific divergence between haplotypes), (2) that gene flow between caves is limited (7 of 10 haplotypes were restricted to a single cave, and FST > 0.80 and P < 0.05 for fifteen of eighteen comparisons between caves), and (3) significant genetic divergence between species (8.8% between Tetracion tennesseensis and Tetracion jonesi). Our results are consistent with previous morphology-based species definitions showing Tetracion tennesseensis and Tetracion jonesi belonging to distinct taxa. Our research contributes to the growing body of phylogeographic information about cave species on the Cumberland Plateau, and provides a point of comparison for future studies of troglobionts and millipedes.
Tennessee, Alabama, USA, millipedes, cytochrome oxidase 1 gene, genetic variation
Millipedes (Diplopoda) are a large, understudied group. Twelve thousand species belonging to sixteen orders have been described and it is estimated that as many as 80, 000 species exist. Little is known about the ecology, life history, and phylogeny of the great majority of species (
Troglobiotic millipedes inhabit caves in temperate and tropical areas (
More than 85 troglobiotic millipede species have been described in North America, most of which belong to the family Chordeumatidae. Some genera are exclusively troglobiotic: e.g. Zygonopus Ryder, 1881 from West Virginia, Mexiterpes Causey, 1963from Mexico and Scoterpes Cope, 1872 from southeastern North America, whereas other genera, such as Pseudotremia Cope, 1869, contain surface-dwelling species as well (
Genetic research on troglobiotic millipedes is limited.
Troglobiotic millipedes belonging to the genus Tetracion Hoffman, 1956(Callipodida, Abacionidae) inhabit caves of the southern Cumberland Plateau in Tennessee and Alabama. Three species have been described: Tetracion jonesi Hoffman, 1956, Tetracion antraeum Hoffman, 1956 and Tetracion tennesseensis Causey, 1959. They are relatively large (up to 8 cm in length) and exhibit troglomorphic characters including lack of pigmentation, reduced ocelli and elongated appendages (
The type species for the genus, Tetracion jonesi, was described from Bat Cave, near Grant, Marshall County, Alabama (
Because classification within Tetracion is based solely on morphological characters, we wanted to test if morphological species definitions corresponded to patterns of genetic variation. We also wanted to understand the population structure of these cave-obligate millipedes and determine if gene flow was occurring between populations. To do this, we sequenced part of the mitochondrial cytochrome oxidase 1 (CO1) gene from across the range of Tetracion tennesseensis and in the northern part of the range of Tetracion jonesi. We expected to find high genetic divergence between species and significant population structure within species. This is the first molecular phylogeographic study of troglobiotic millipedes.
Materials and methods CollectingTetracion specimens were collected from eleven caves on the southern Cumberland Plateau between 1996 and 2009. Specimens were collected from Franklin, Grundy, Warren, White and Van Buren Counties in Tennessee and Jackson County in Alabama. Due to the uncertain status of Tetracion antraeum, we refer to our specimens from Jackson County, Alabama and Franklin County, Tennessee as Tetracion jonesi. Our sampling covered the full range of Tetracion tennesseensis and the northern portion of the range of Tetracion jonesi (Figure 1). After the arrival of White Nose Syndrome to northern Tennessee in early 2010, we canceled all sampling in Alabama to avoid the possibility of spreading the fungus south. As a result we did not sample the southern portion of the range of this genus. Further sampling across the range of Tetracion in Alabama is required to determine if there is genetic evidence for the distinctiveness of Tetracion antraeum. We refer to all caves by their Tennessee Cave Survey or Alabama Cave Survey names. Due to the sensitive nature of cave habitats, cave coordinates are not published in this manuscript.
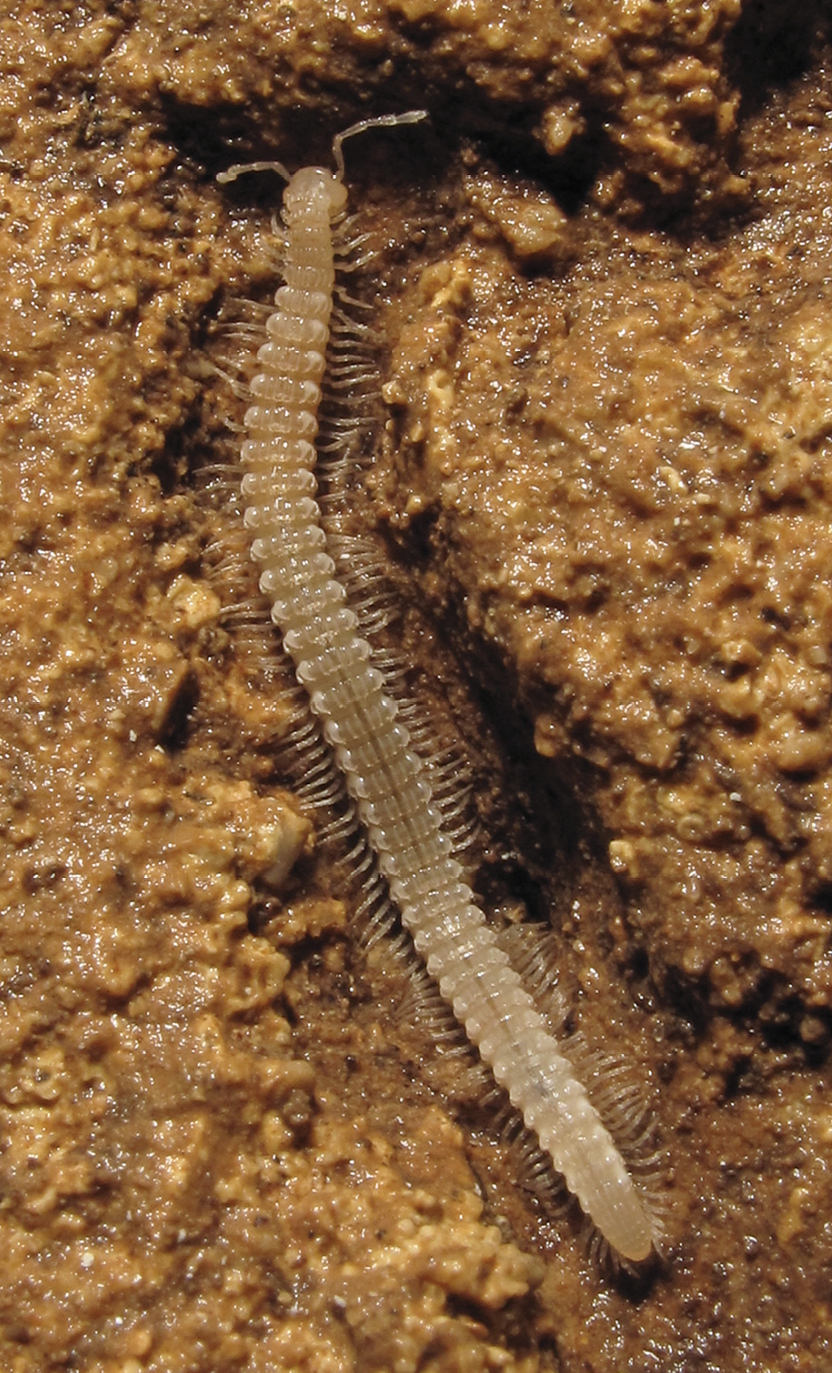
Tetracion jonesi individual from Williams Saltpeter Cave, Jackson County, Alabama. Photo by Alan Cressler.
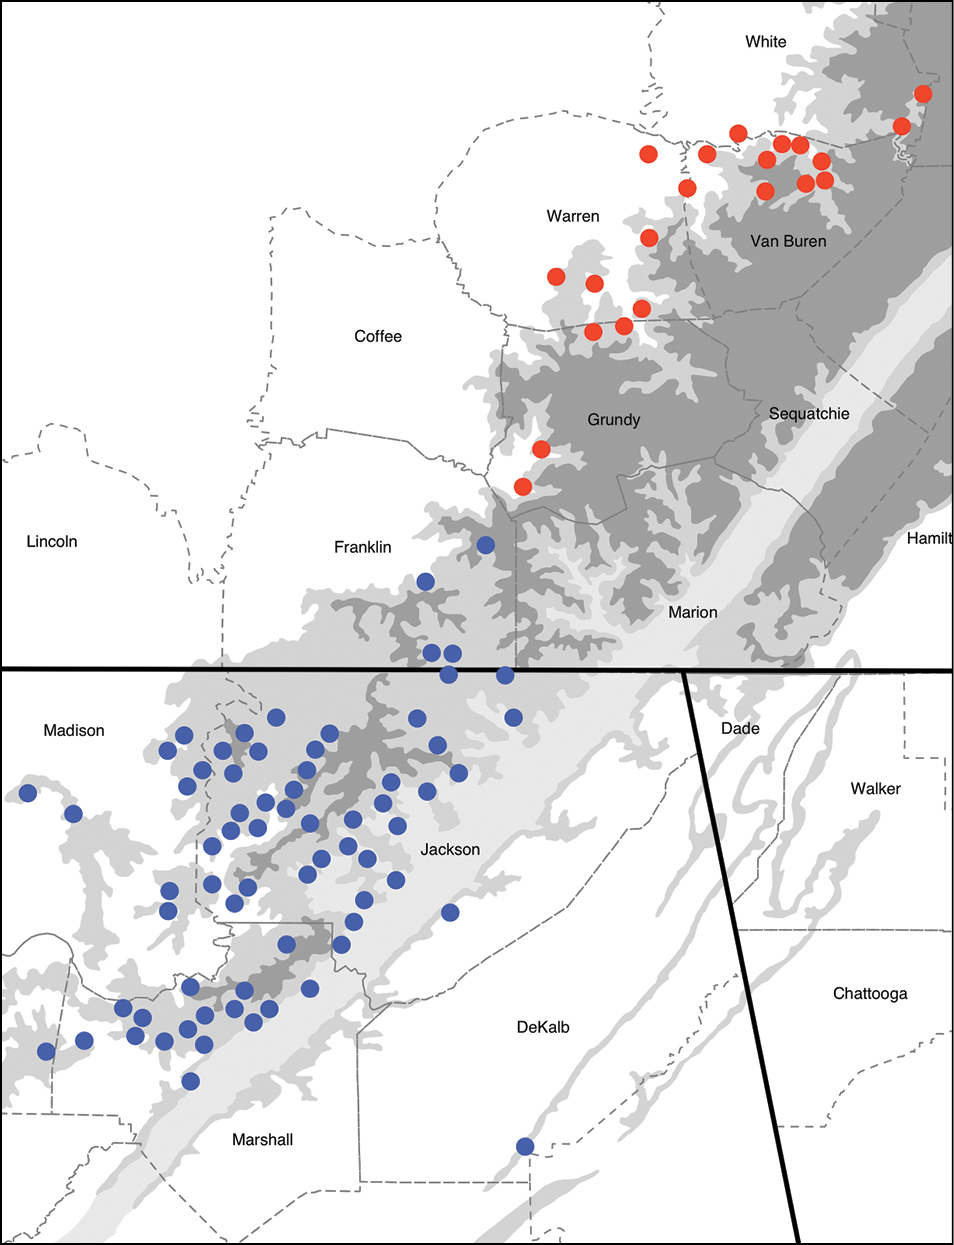
The distribution of populations of the millipede genus Tetracion (Callipodida: Abacionidae). Tetracion tennesseensis populations are in red, and Tetracion jonesi and Tetracion antraeum populations are in blue. Higher altitudes are indicated by darker shades of grey. Dashed lines indicate county boundaries and the solid lines indicate state boundaries between Tennessee, Alabama and Georgia.
As Tetracion and Abacion Rafinesque, 1820are the only genera of the tribe Abacionini in the family Abacionidae (
We followed the manufacturer’s protocol from the DNeasy Blood and Tissue Kit (Qiagen; P/N: 69506) for DNA extractions. Millipede tissue was taken from the legs, antennae, or a section of the trunk. We used polymerase chain reactions (PCR) to amplify the mitochondrial CO1 gene. Amplitaq Gold PCR Master Mix (Applied Biosystems; P/N: 4318739) was added to all reactions and several different primer combinations were necessary for successful amplifications. The most successful amplifications for Tetracion jonesi were obtained using the primer combinations HCO1-tet (5’-GATATAGAATAGGATCTCCTCCAGC-3’) and LCO1-milli (5’-TCCACAAACCACAAAGACATTGG-3’), and for Tetracion tennesseensis HCO1-Tetten (5’-TCCTCCAGCGAGCAGGATCAAAGA-3’) and LCO1-Tetten (5’- ATTTTTGGAGCTTGAGCTGCCATG-3’). We cycled all reactions once for 5 min at 95°C and 35 times for 15 s at 95°C, 15 s at 50°C, and 1 min at 72°C. Occasionally, we lowered the annealing temperature from 50°C to 45°C to improve amplification. Successful PCR reactions were purified following the manufacturer’s protocol for the QIAquick PCR Purification Kit (Qiagen; P/N: 28106) and both strands were sequenced on an Applied Biosystems 3730 sequencer. All sequences have been submitted to GenBank (Accession #JN656558-JN656611).
Genetic analysesSequences were aligned and edited using Sequencher (v. 4.9; Gene Codes Corp., Ann Arbor, MI) and the number of indels, transitions and transversions were counted by eye. We used TCS (v. 1.21;
To test for monophyly of Tetracion tennesseensis and Tetracion jonesi, we constructed a phylogenetic tree.We used MrBayes (v. 3.1.2;
We obtained sequences from 54 individuals: 17 from Tetracion jonesi, 36 from Tetracion tennesseensis, and 1 from Abacion magnum (Table 1). Average sequence length was 568 bp, with a maximum length of 571 bp and a minimum length of 541 bp; 30, 090 bp were sequenced in total. No indels, gaps, or stop codons were present and seven ambiguous bases were located. Within Tetracion, there were 55 variable sites of which 40 were transitions, 12 were transversions, and 3 were sites where both a transition and transversion had occurred. Of those variable sites, 41 were fixed differences between Tetracion jonesi and Tetracion tennesseensis including 27 transitions, 11 transversions, and 3 sites where both a transition and transversion had occurred. There was one fixed amino acid difference between Tetracion jonesi and Tetracion tennesseensis and there were five fixed amino acid differences between Abacion and Tetracion.
Summary of Tetracion genetic samples including cave sites, their Tennessee or Alabama Cave Survey number, sample size (N), and haplotypes observed.
| Cave | County | State | Cave Survey # | N | Haplotypes |
|---|---|---|---|---|---|
| Tetracion tennesseensis | |||||
| Coppinger | Grundy | TN | TGD9 | 8 | T1 (x5), T3 (x3) |
| Crystal | Grundy | TN | TGD10 | 5 | T1 (x5) |
| Woodlee | Grundy | TN | TGD31 | 5 | T1 (x4), T2 |
| Case Brothers | Van Buren | TN | TVB169 | 2 | T5 (x2) |
| Jaco Springs | Warren | TN | TWR317 | 6 | T4 (x6) |
| Little Bat | Warren | TN | TWR18 | 5 | T6 (x5) |
| Lockwood | White | TN | TWH19 | 5 | T5 (x5) |
| Tetracion jonesi | |||||
| Grapevine | Franklin | TN | TFR423 | 5 | J1 (x4), J3 |
| Keith | Franklin | TN | TFR14 | 5 | J4 (x5) |
| Little Crow Creek | Franklin | TN | TFR354 | 1 | J2 |
| Jess Elliot | Jackson | AL | AJK323 | 6 | J2 (x6) |
Six haplotypes were present in Tetracion tennesseensis (T1 to T6; Figure 3). Genetic variation within Tetracion tennesseensis was low as haplotypes differed by no more than eight nucleotides. Clustering was apparent in the Tetracion tennesseensis network; haplotypes T1-T4 formed one cluster whereas haplotypes T5-T6 formed another cluster which differed from the first cluster by four nucleotides (Figure 3). Four haplotypes were limited to a single cave (T2, T3, T4, T6) and two were found in multiple caves (T1 and T5; Figure 4).The most common haplotype (T1) was shared among 14 out of 36 individuals. The least common haplotype (T2) was present in only one individual. Five of seven cave populations were fixed for a single haplotype (Table 1; Figure 4). Woodlee and Coppinger Caves each had populations containing two different haplotypes. In both cases the two haplotypes present in a single cave differed by a single nucleotide (Table 1; Figure 3). Consistent with the observation that most caves had distinct haplotypes, FST values between caves were high and significant (FST > 0.90, P < 0.05; Table 2) for twelve of fifteen comparisons. The only exceptions were the comparisons between Coppinger, Crystal and Woodlee Caves, which shared haplotype T1 (Table 1) and were non-significant (Table 2). Although caves generally did not share haplotypes, mean CO1 divergence between caves was low (<1.4% for all comparisons; Table 2).
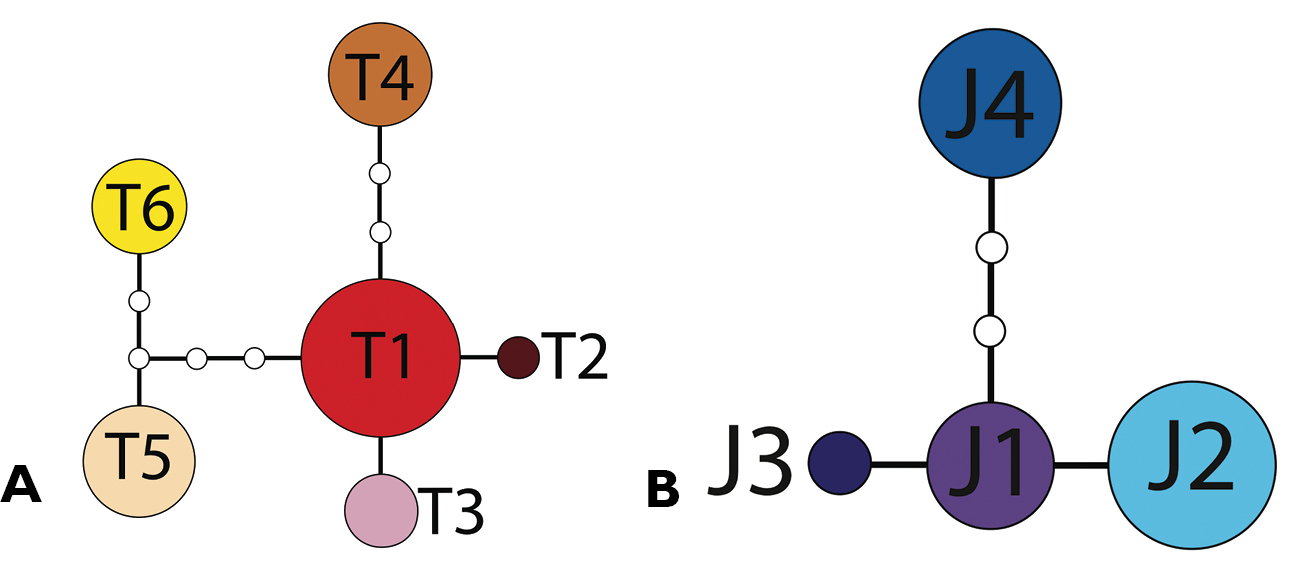
Haplotype networks for A Tetracion tennesseensis with haplotypes T1-T6, andB Tetracion jonesi with haplotypes J1-J4. Haplotype names correspond to those designated in Table 1. Each nucleotide difference is indicated by a single branch segment, and the frequency of each haplotype is indicated by the relative area of the haplotype circle. Extinct and/or unsampled haplotypes are indicated by small, open circles. The Tetracion tennesseensis and Tetracion jonesi networks differ by 42 differences.
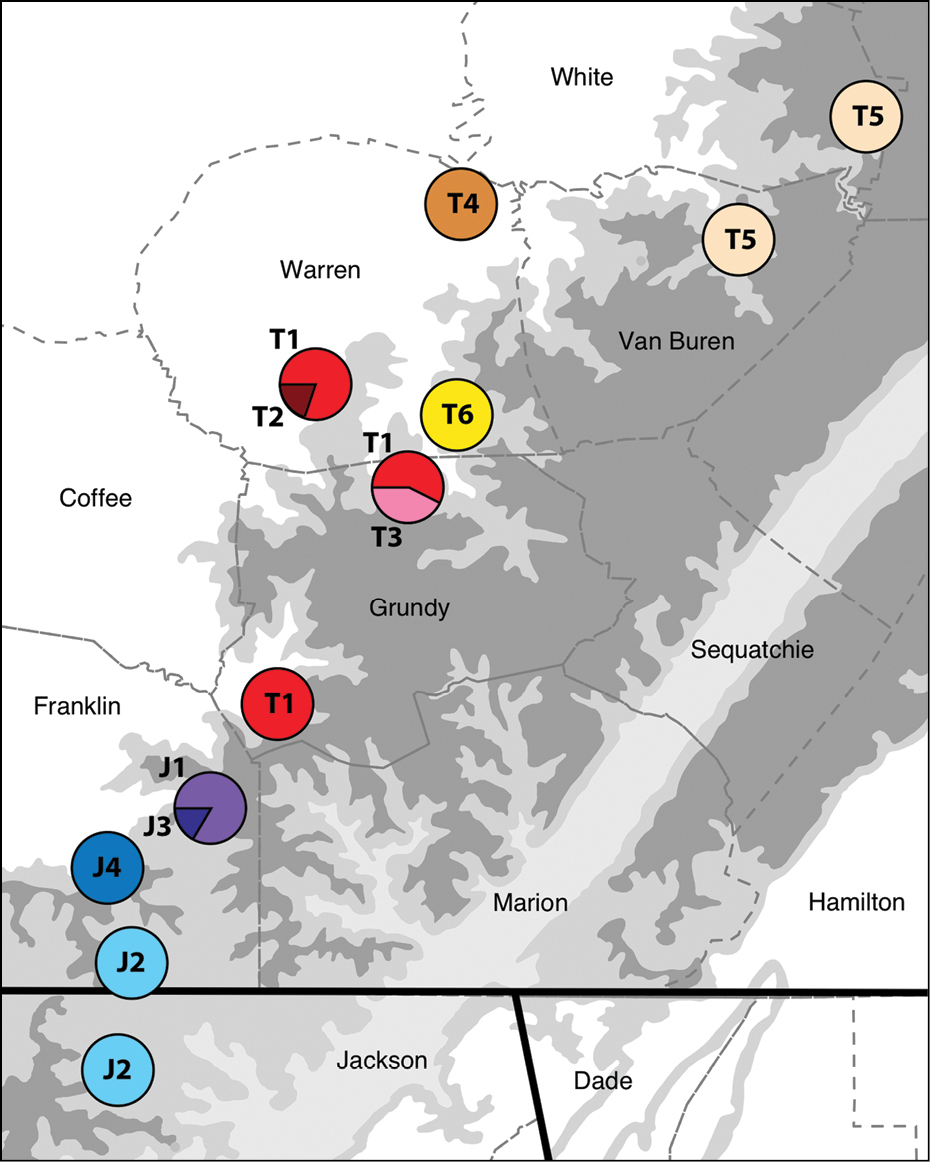
Distribution of Tetracion haplotypes across the southern Cumberland Plateau in Tennessee and Alabama. Haplotypes from Tetracion tennesseensis (T1-T6) and Tetracion jonesi (J1-J4) correspond to those designated in Table 1. Higher altitudes are indicated by darker shades of grey. Dashed lines indicate county boundaries and the solid lines indicate state boundaries between Tennessee, Alabama and Georgia.
Mean p-distance between Tetracion populations (above diagonal), and population pairwise FST values (below diagonal; *P < 0.05, **P < 0.01).
| Tetracion tennesseensis | ||||||
| Coppinger | Crystal | Woodlee | Jaco Springs | Little Bat | Lockwood | |
| Coppinger | 0.001 | 0.001 | 0.006 | 0.011 | 0.007 | |
| Crystal | 0.20 | 0.000 | 0.005 | 0.010 | 0.007 | |
| Woodlee | 0.17 | 0.00 | 0.006 | 0.011 | 0.008 | |
| Jaco Springs | 0.91** | 1.00** | 0.94** | 0.012 | 0.013 | |
| Little Bat | 0.94** | 1.00* | 0.96** | 1.00** | 0.005 | |
| Lockwood | 0.92** | 1.00** | 0.95** | 1.00** | 1.00** | |
| Tetracion jonesi | ||||||
| Grapevine | Keith | Jess Elliott | ||||
| Grapevine | 0.006 | 0.002 | ||||
| Keith | 0.94** | 0.007 | ||||
| Jess Elliott | 0.85** | 1.00** | ||||
Four haplotypes were present within Tetracion jonesi (J1-J4; Figure 3). Genetic variation within Tetracion jonesi was lower than within Tetracion tennesseensis as haplotypes differed by no more than four nucleotides. The most common haplotype (J2) was present in 7 out of 17 individuals; the least common haplotype (J3) was found in only one individual. Haplotypes were not shared between caves except J2 which was present in two caves (Jess Elliot and Little Crow Creek) and all cave populations were fixed for a single haplotype except for the Grapevine population which contained two haplotypes (J1 and J3; Figure 4), that differed by a single nucleotide (Figure 3). FST values between caves were high and significant for all comparisons (FST > 0.80, P < 0.01; Table 2). Mean genetic distance between caves ranged from 0.2-0.7% (Table 2).
Interspecific variationWithin Tetracion, interspecific genetic variation was much greater than intraspecific genetic variation. Kimura 2-parameter (K2P,
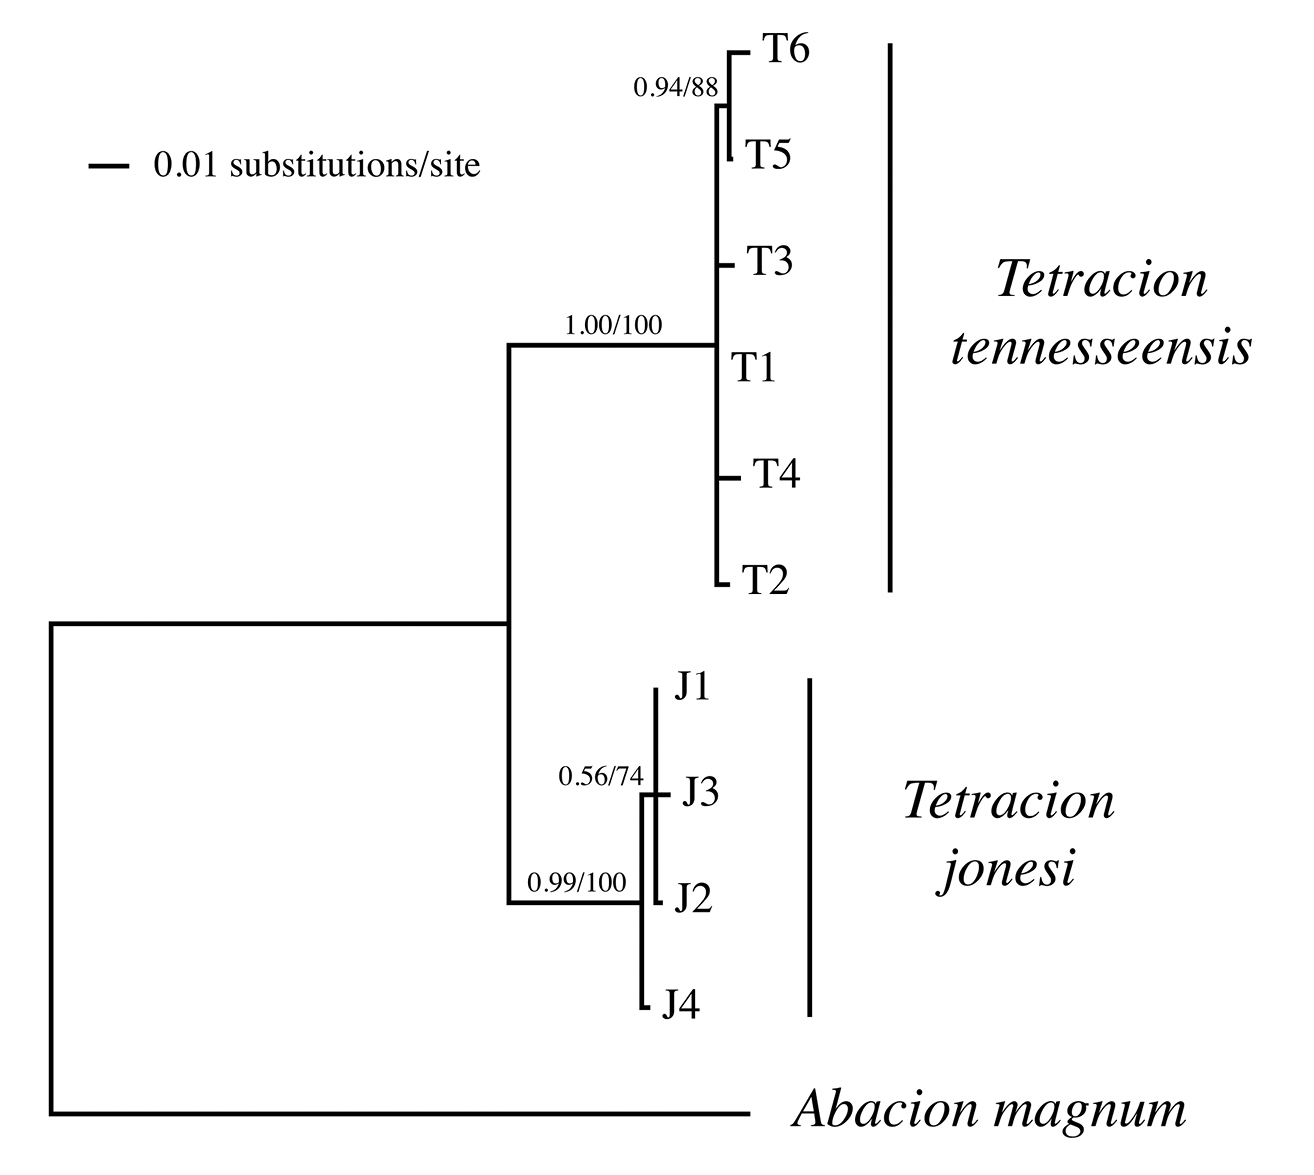
Bayesian majority rule consensus phylogenetic relationships for Tetracion cytochrome oxidase I haplotypes. Bayesian clade credibility values and branch-and-bound parsimony bootstrap values are indicated above branches.
We found low intraspecific genetic variation in Tetracion, both in the number of haplotypes observed and in the amount of divergence between haplotypes. Only ten haplotypes were observed and populations were generally fixed for a single haplotype. As our sample size was small (mean = 4.8 individuals/cave), it is possible that further sampling would reveal greater diversity within populations. The maximum intraspecific divergence between haplotypes was 1.4%. Genetic variation was lower within Tetracion jonesi populations but that may be due to sampling bias as we did not survey the entire range of this species. Such low intraspecific genetic variation contrasts with other troglobiotic organisms from the Cumberland Plateau. For example, Snowman et al.(2010) found high genetic variation (up to 4%) between populations of the cave spider Nesticus barri Gertsch, 1984, and
Although the differences between Tetracion populations were not great, populations were generally fixed for a single haplotype. Across eleven populations, only three haplotypes were shared between caves, and in each case the haplotypes were shared by geographically proximate caves. In the three caves with two haplotypes, the haplotypes in those caves differed by a single nucleotide, which is consistent with in situ evolution through mutation, as opposed to migration from a genetically distinct population. These patterns are similar to those observed in other terrestrial troglobionts from the Cumberland Plateau (
Our molecular results were consistent with previous morphology-based species definitions. Interspecific genetic variation in Tetracion was high (8.8%). Several studies have used the CO1 gene to study millipede phylogeny and population structure, and the divergence between Tetracion jonesi and Tetracion tennesseensis was greater than that observed for most interspecific comparisons within Appalachioria Marek and Bond, 1996 (
Tetracion is an interesting contrast to other genera of troglobiotic millipedes known from the Cumberland Plateau and adjacent areas. Tetracion is not speciose, and each of its species has a large range spanning several counties and dozens of caves. Scoterpes, with fourteen troglobiotic species (
We thank R. Hoffman and W. Shear for advice on Tetracion taxonomy. We also thank N. Hollingshead for GIS assistance, A. Cressler for sharing his Tetracion photograph, G. Moni for sharing Tennessee Cave Survey information, S. Shaw for sharing Alabama Cave Survey information, and J. Shultz and C. Cunningham for providing the Abacion specimen. H. Enghoff and P. Stoev provided helpful comments. This project was supported by Sewanee: The University of the South.